portfolio / EEG-to-Image Generation for Alzheimers Research _
For my final year deep learning module, our group spent a semester looking at whether EEG-to-image generation models could be applied to Alzheimer’s disease research. The idea was to take frameworks that decode brain signals into images, simulate what an Alzheimer’s patient’s EEG looks like, and see what happens when you push that through.
My contributions were: partly evaluating the frameworks we chose between, critiquing the dataset the field benchmarks on, and running an experiment where we reversed the AD simulation to test a hypothesis about which frequency bands are actually doing the visual decoding work.
Why EEG-to-Image for Alzheimer’s?
Alzheimer’s progressively strips away a person’s ability to communicate. In advanced stages, patients often can’t speak or gesture — but they still perceive and think. The motivating question was whether you could decode what someone is experiencing from their brain signals alone, even when they can’t express it.
A few concrete applications drove the research direction:
- Communication — EEG-to-image could act as a visual translator, converting internal mental imagery into something displayable, giving caregivers clues about a patient’s immediate needs.
- Early detection — Alzheimer’s affects visual-spatial processing early. If a reconstructed image is significantly degraded versus a healthy control, that degradation might itself be a diagnostic signal.
- Memory therapy — Reminiscence therapy shows patients old photos to stimulate memory. EEG-to-image could validate whether a patient is genuinely engaging with a stimulus, even if they can’t verbally confirm it.
How Alzheimer’s Changes EEG
A literature review on AD’s EEG signature comes down to a consistent pattern across multiple studies: slow waves increase, fast waves decrease.
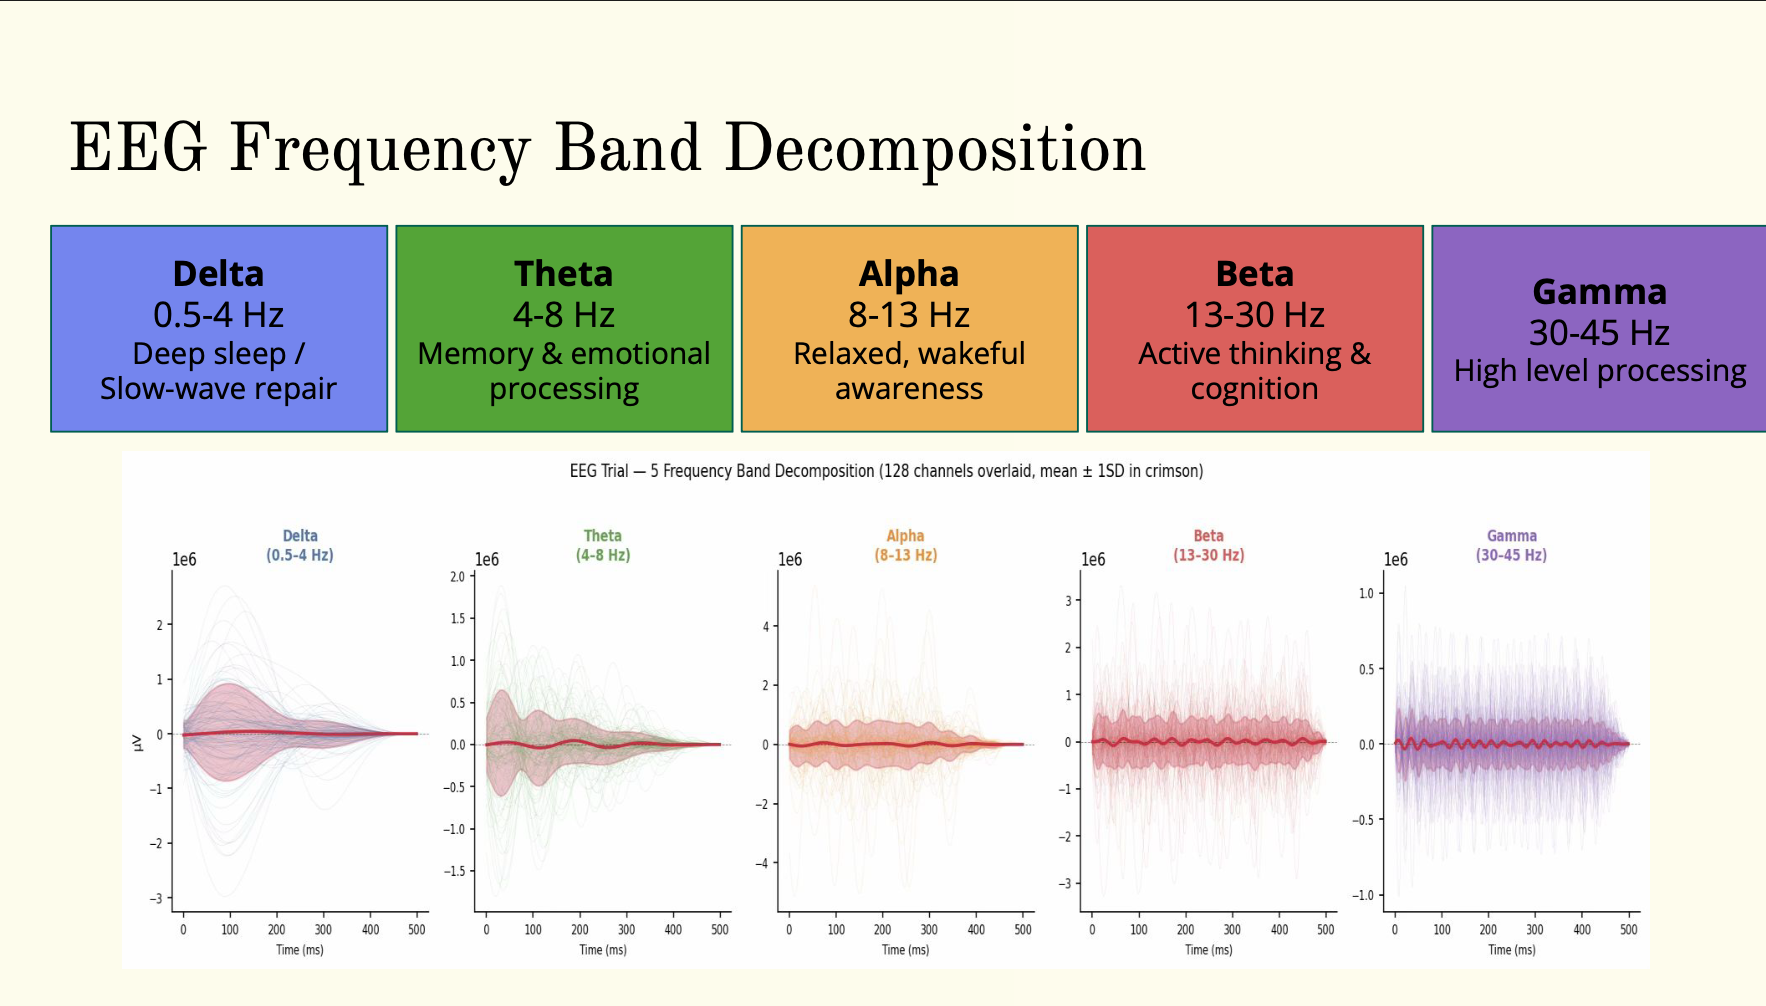
| Band | Range | AD Change | Scale Applied |
|---|---|---|---|
| Delta | 0.5–4 Hz | ↑ +50% | ×1.50 |
| Theta | 4–8 Hz | ↑ +70% | ×1.70 |
| Alpha | 8–13 Hz | ↓ −60% | ×0.40 |
| Beta | 13–30 Hz | ↓ −50% | ×0.50 |
| Gamma | 30–45 Hz | ↓ −40% | ×0.60 |
The delta increase is particularly notable — it goes in the opposite direction to normal ageing, making it a disease-specific signature rather than just a general cognitive decline marker. Alpha and beta, the bands associated with relaxed awareness and active cognition respectively, are the ones most visibly suppressed.
The hypothesis going into the experiments: if a framework genuinely decodes visual content from EEG, AD-simulated signals should produce degraded but still recognisable outputs.
SYNAPSE
We evaluated DreamDiffusion, GWIT, and SYNAPSE and settled with SYNAPSE. SYNAPSE addressed most of what was wrong with the alternatives, and was the clear choice for running experiments.
A couple reasons for choosing SYNAPSE:
Practical size — 152M parameters and trainable on a single consumer GPU (RTX 3090 territory), versus GWIT’s 368M. It also achieves state-of-the-art FID of 46.91 on the EEGCVPR40 dataset across multiple subjects.
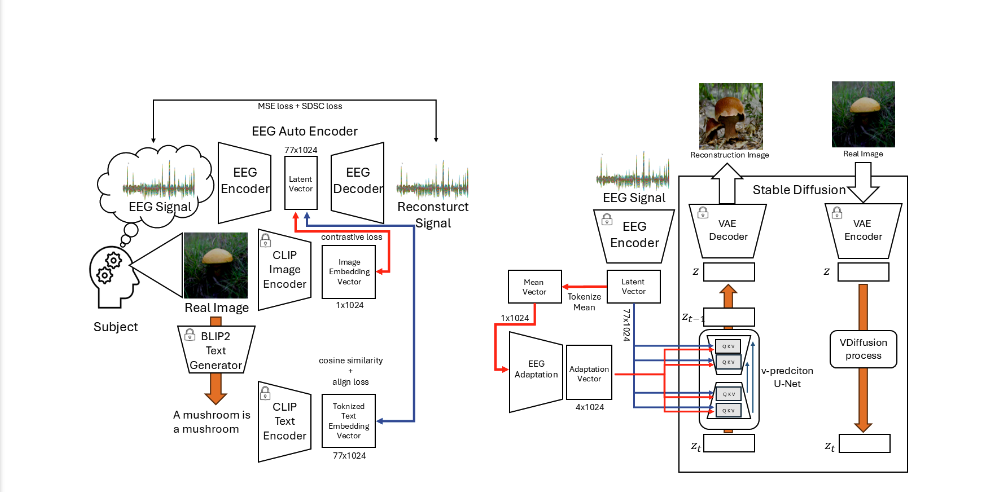
Hybrid autoencoder — It uses 1D convolutions for temporal patterns and Multi-Head Self-Attention to map relationships between brain regions, treating all 128 EEG channels independently rather than flattening them.
The Dataset Problem
Almost every major EEG-to-image paper benchmarks on EEGCVPR40 (also called Brain2Image or ImageNet-EEG) — 128 EEG channels, 6 subjects, 40 ImageNet object classes.
The recording protocol is the issue: it’s a block design. All images of the same class are shown to the subject consecutively. This creates a serious confound — slow temporal artefacts in the EEG become correlated with the class label.
The three artefact types that matter here:
Baseline drift — a gradual low-frequency deviation from zero voltage caused by sweat, electrode movement, or temperature changes. It’s correctable with high-pass filtering, but the point is it varies predictably over the course of a session.
Electrode impedance changes — optimal impedance is below 5–10 kΩ. Sweat, drying electrode gel, and movement all change conductivity in ways that drift over time.
Fatigue-related drift — as a subject tires across a long recording session, theta and delta power increase while alpha decreases in frontal and occipital regions. This is precisely the spectral signature we’re associating with Alzheimer’s.
When you show all “dog” images consecutively, fatigue-related drift gets baked into the “dog” class label. The encoder learns to identify which block of trials it’s in, not which dog it’s looking at. This is why published accuracies of up to 99.5% on this dataset are almost certainly inflated — they reflect block timing cues, not actual visual decoding. The SYNAPSE paper, the Alljoined1 team, and a Nature paper on the topic have all flagged this.
The Experiment
We applied the AD band-power transformations to the EEGCVPR40 dataset and ran inference through SYNAPSE. The hypothesis was blurry but recognisable outputs. That’s not what happened. The generated images were completely unrelated to the ground truth.
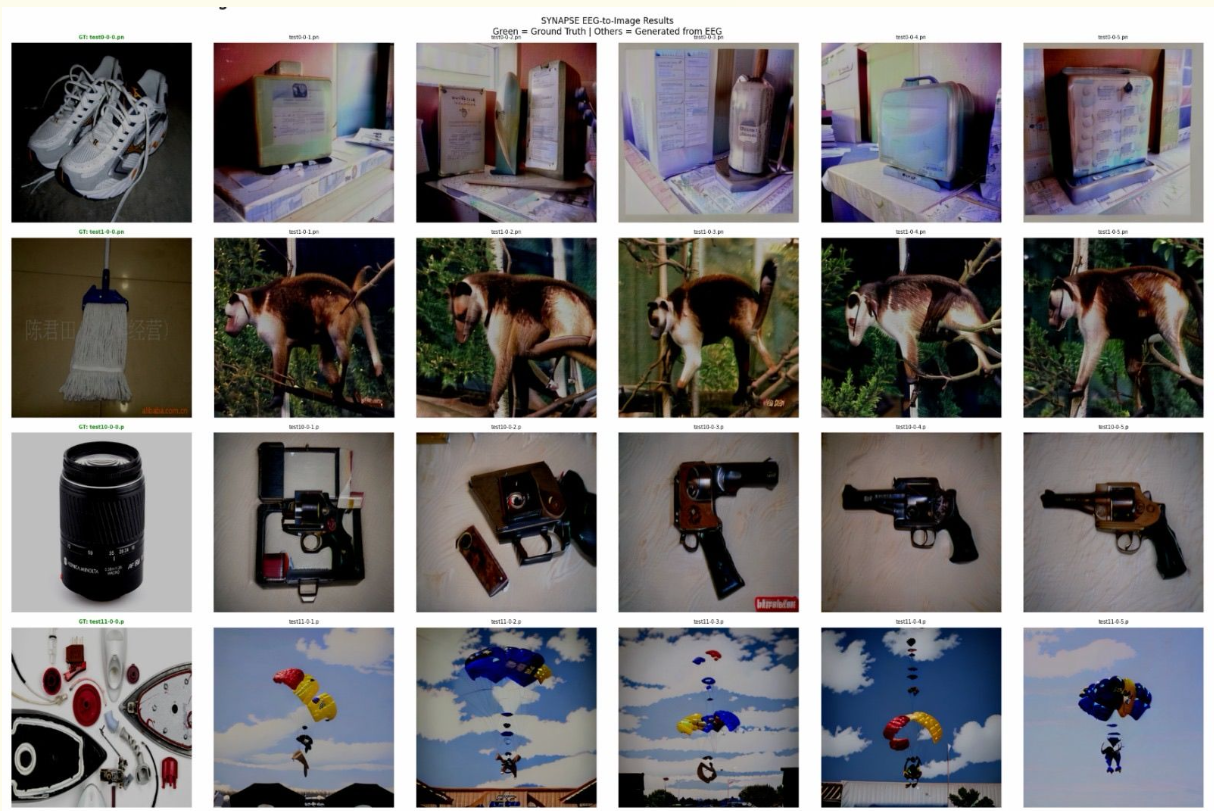
The most likely explanation: by reducing alpha, beta, and gamma — the bands most involved in active visual processing — there’s very little visual signal left for the model to decode. Rather than producing a degraded version of the correct image, it loses the content entirely and generates something semantically unconnected.
Confirming the Hypothesis
To test this interpretation, the transformation was reversed — boosting alpha, beta, and gamma while reducing delta and theta — and inference was run again.
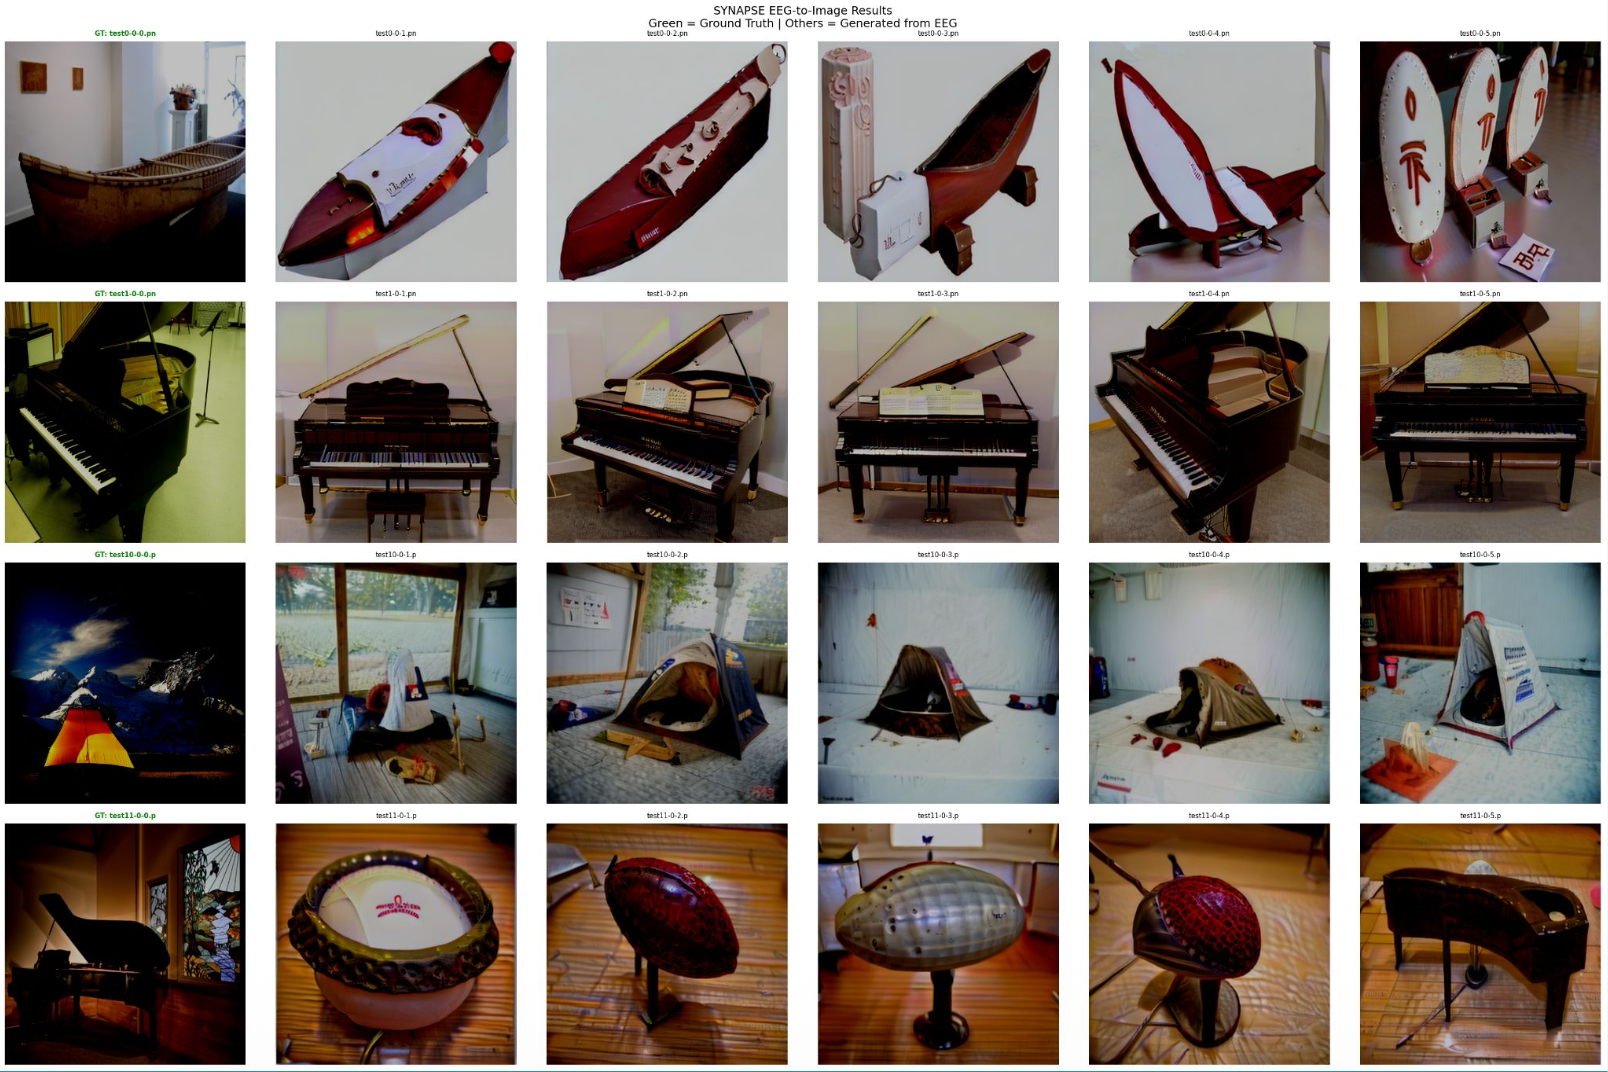
Ground truths 0 to 3 matched their generated counterparts. Reducing slow waves and amplifying the cognitively-associated bands produced outputs that were structurally coherent with the ground truth images.
This confirms that alpha, beta, and gamma are the frequency bands load-bearing for visual reconstruction in SYNAPSE. It also reframes the original result — the AD simulation didn’t fail to produce degraded outputs; it showed what happens when the visual information in the signal is genuinely gone. The suppression of those bands in AD patients isn’t just a biomarker of the disease, it’s actively what removes the visual signal from the EEG.
Alternative Datasets for Future Work
The block-design problem with EEGCVPR40 makes it a poor foundation for AD research. Two newer datasets were looked at that address it.
Alljoined1
Designed specifically to fix the block-design flaw. It uses response-locked stimuli with a 300ms SNR-optimised window, so temporal artefacts don’t correlate with labels. 8 subjects, ~10,000 images each across 80 MS-COCO categories, with transparent data quality scores per participant. Five times more images per subject than Brain2Image.
The tradeoffs: 64 channels versus 128, and being relatively new (CVPR 2024) means fewer published baselines to compare against.
Alljoined1.6M
The largest publicly available EEG-to-image dataset. 20 subjects × 4 sessions → 1.6 million trials, 16,740 unique images from the THINGS initiative. Performance scales log-linearly with data volume and hasn’t saturated yet at full size, which is encouraging.
The catch is consumer-grade hardware — Emotiv Flex 2 at 32 channels (~$2.2k). The ENIGMA model benchmarked on this dataset shows that the same number of training trials yields lower performance than research-grade 64-channel data. More data, but less signal per trial.
| EEGCVPR40 | Alljoined1 | Alljoined1.6M | |
|---|---|---|---|
| Subjects | 6 | 8 | 20 |
| Channels | 128 | 64 | 32 |
| Images | 2,000 | ~10,000 | 16,740 |
| Block design flaw | Yes | No | No |
| Best use | Model benchmarking | Clean decoding research | Scale experiments |
For AD research, Alljoined1 is the more appropriate starting point — cleaner signals and no artefact contamination, even if it means half the channel count.
Summary
The project confirmed that EEG-to-image models can decode meaningful visual content from brain signals, but the dataset the whole field benchmarks on is fundamentally compromised. More usefully, the inverse experiment gave a clear answer about what actually drives visual reconstruction — the alpha, beta, and gamma bands that Alzheimer’s specifically suppresses.
The real limitation of the work is that we were simulating AD by scaling band power on healthy EEG. The next step would be running SYNAPSE on actual clinical EEG from AD patients - a larger undertaking, but the groundwork for knowing which signals to look for and which framework to use is there.